M1: DIAGRAMMING
DESIGN PRECEDENT
In this first module, we were tasked to create a digital model of an existing pavilion from a set of orthographic drawings, and then analyze and represent circulation and threshold through the use of diagrams as a means of communication.


precedent study


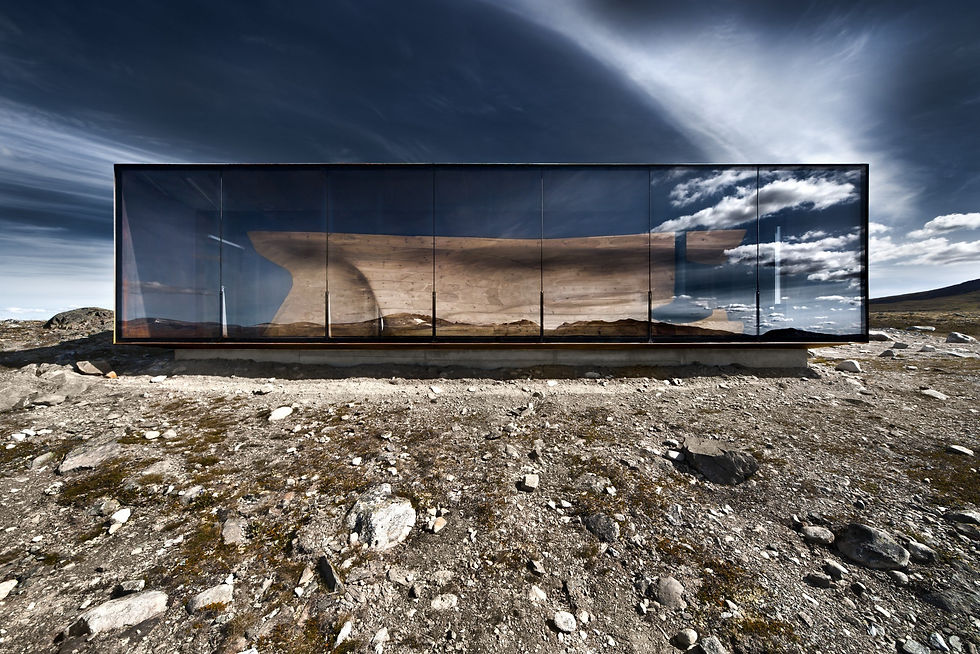
The pavilion I was assigned to was Tverrfjellhytta, Norwegian Wild Reindeer Pavilion by Snøhetta architects. The reindeer pavilion began its construction in 2009 and was completed in 2011. The 90 m2 pavilion is opened to the public, and can be accessed by a 1.5 km hiking trail that leads the visitors to the outskirts of the Dovrefjell National Park in Hjerkinn, Dovre, Norway. The pavilion acts as an observation pavilion which overlooks the beautiful mountain Snøhetta.
Drawing upon the history of the landscape, Snøhetta architects has created a space of warmth and comfort. The Dovrefjell mountain range is of significant importance to Norway as it acts as a barrier between the northern and southern parts of Norway - and is home to numerous tales and myths connected to the mountains. With this in mind, the design of this keyless structure was made based on a 'contrast between ideas' - a rigid outer shell and a soft, organic inner core that works in harmony to create this pavilion. This idea of contrast was established through the use of different material and form. The interior is entirely made out of wood blooks that were pegged together, and its organic form was intended to represent a rock or ice that has been consumed by natural forces such as wind or running water. This organic shape creates a protected and warm gathering place. On the other hand, the simple. rectangular frame that holds the structure is made of raw steel and glass.
process
modelling process


diagramming process


We were given a set of orthographic drawings and I used that as a starting point to begin the modelling process of the pavilion. I imported the section cut of the pavilion into Rhino and traced it using polylines. I then placed the corresponding section cut on the plan. I copied my section cut multiple times and adjusted the seats and curvature based on information given on the plan. After the section cuts were made, I used the 'Loft' function in Rhino to connect them altogether.
After the modelling process of the interior was completed, I modelled the rectangular frame using information from the orthographic drawings. I traced the frames on the plan and extruded them according to the height of the structure (which was given in the drawings).
When the modelling process was completed, I started to brainstorm ideas for my circulation and threshold diagram (which will be discussed below). This process was done not only through my own analysis, but also through precedent study. This was important because this informed me of what the intent of the pavilion was, who this pavilion was meant to be created for, and many more.
circulation diagram
When I made my circulation diagram, I focused on what the pavilion was intended for - which is an observatory pavilion, where people could sit, watch, and enjoy the scenery. With this in mind, I wanted to focus on how people utilize the space and seats in the pavilion and how factors, such as sunlight, affected this.
SUNLIGHT CIRCULATION
The use of large floor to ceiling windows implied that sunlight penetration was a key factor that affected how people use the space. This diagram was made to show how much sunlight each area receives and relating that to how people utilize the spaces.
AREAS OF PAUSE
This part of the circulation diagram observed the typical activities done in an observatory pavilion, i.e. sitting and standing, and the duration.
MAIN CIRCULATION
This circulation diagrams indicate main areas of movement in and out of the pavilion.

threshold diagram
SHADOW THRESHOLD
This shadow threshold diagram was created to show how the shadows affect how space is utilized. This shadow diagram is related to the circulation diagram (i.e. people spend more time in places that are shaded).
VISUAL THRESHOLD
In an observatory pavilion such as this one, views are critical and this visual threshold diagram was created to show in which areas most people spend time in / the typical spots people would stand on, and whether or not their views, be it towards the mountains or towards the pavilion, are blocked.
PHYSICAL THRESHOLD
This diagram highlights the architectural elements that divide the interior spaces, and also establish a sense of privacy from the public space (the outdoors)/

3D model
References:
https://snohetta.com/project/2-tverrfjellhytta-norwegian-wild-reindeer-pavilion
https://vimeo.com/184228819?embedded=true&source=video_title&owner=38931617
https://www.dezeen.com/2011/11/01/norwegian-wild-reindeer-centre-pavilion-by-snohetta/
https://www.instagram.com/p/CB6bCa1FMzG/?utm_source=ig_web_copy_link